Plotting
1)pylab
explore idea of using existing library procedures to VISUALIZING (using graphs)
to provide an intuitive sense of different algorithms
leveraging an existing library, rather than writing procedures from scratch
#图片生成在同一张图
import pylab as plt
plt.plot(mySamples, myLinear)
plt.plot(mySamples, myQuadratic)
plt.plot(mySamples, myCubic)

#每个图生成单独页面
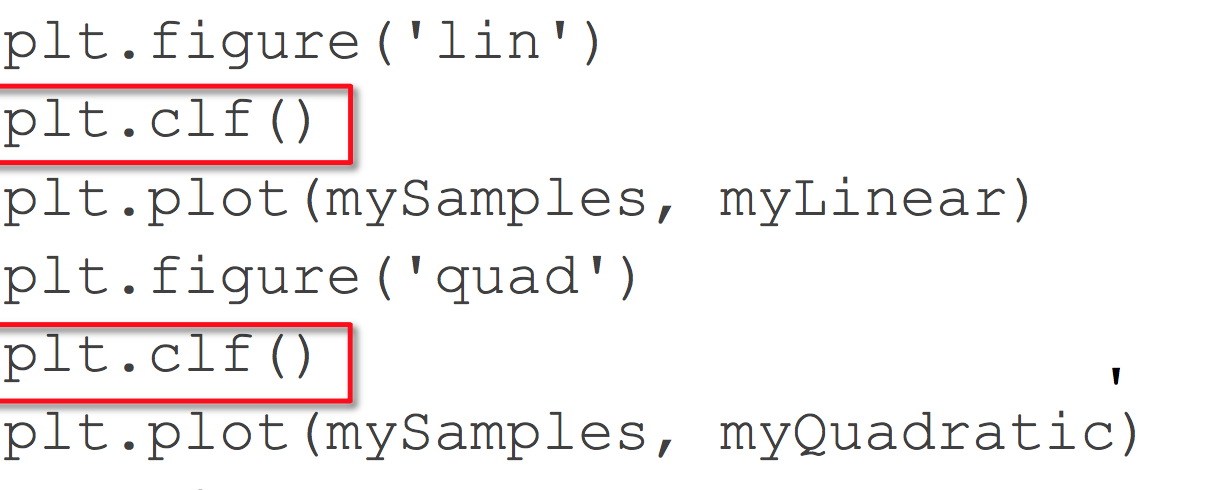
plt.figure('lin')
plt.plot(mySamples, myLinear)
plt.figure('quad')
plt.plot(mySamples, myQuadratic)
plt.figure('cubic')
plt.plot(mySamples, myCubic)
2)cleaning up windows
 3) comparing with plots
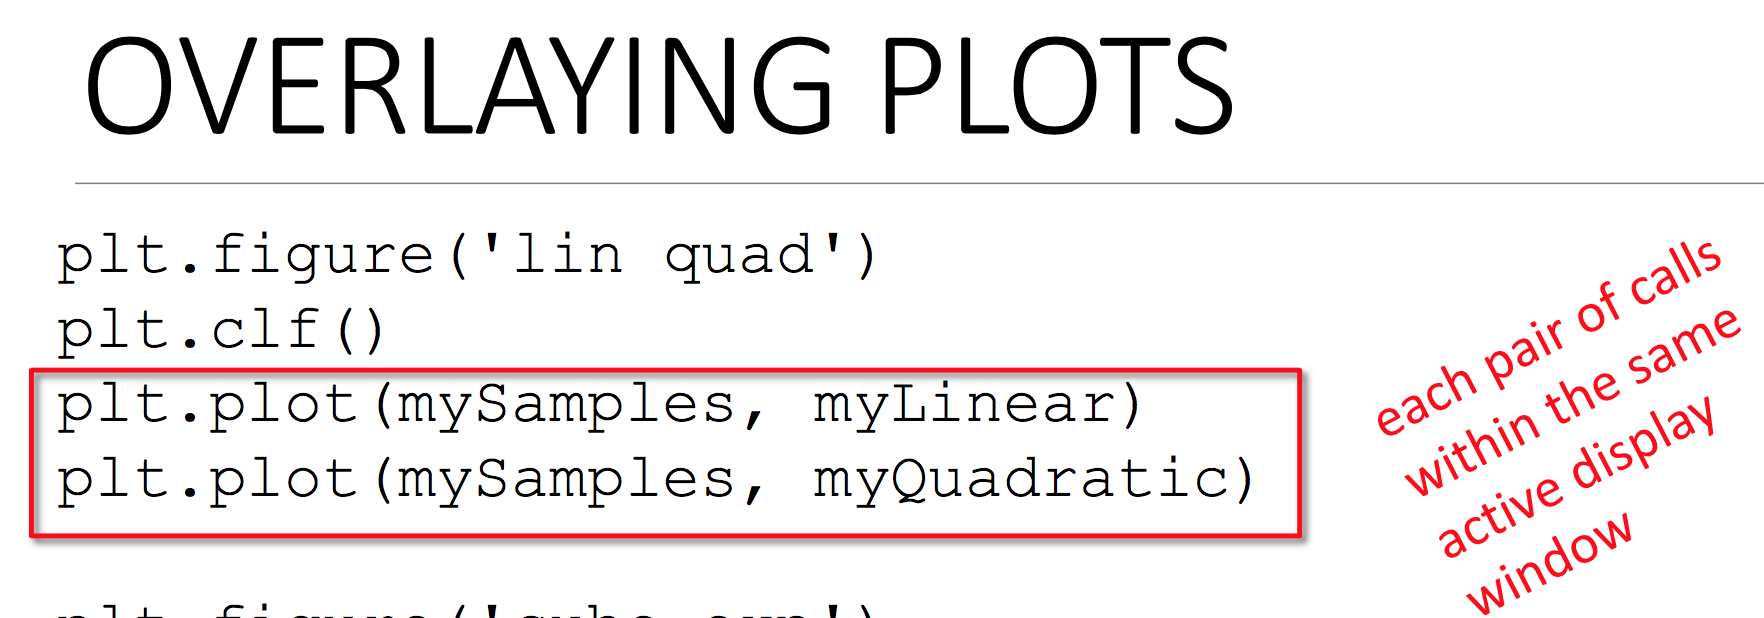
overlaying plots on the same display window
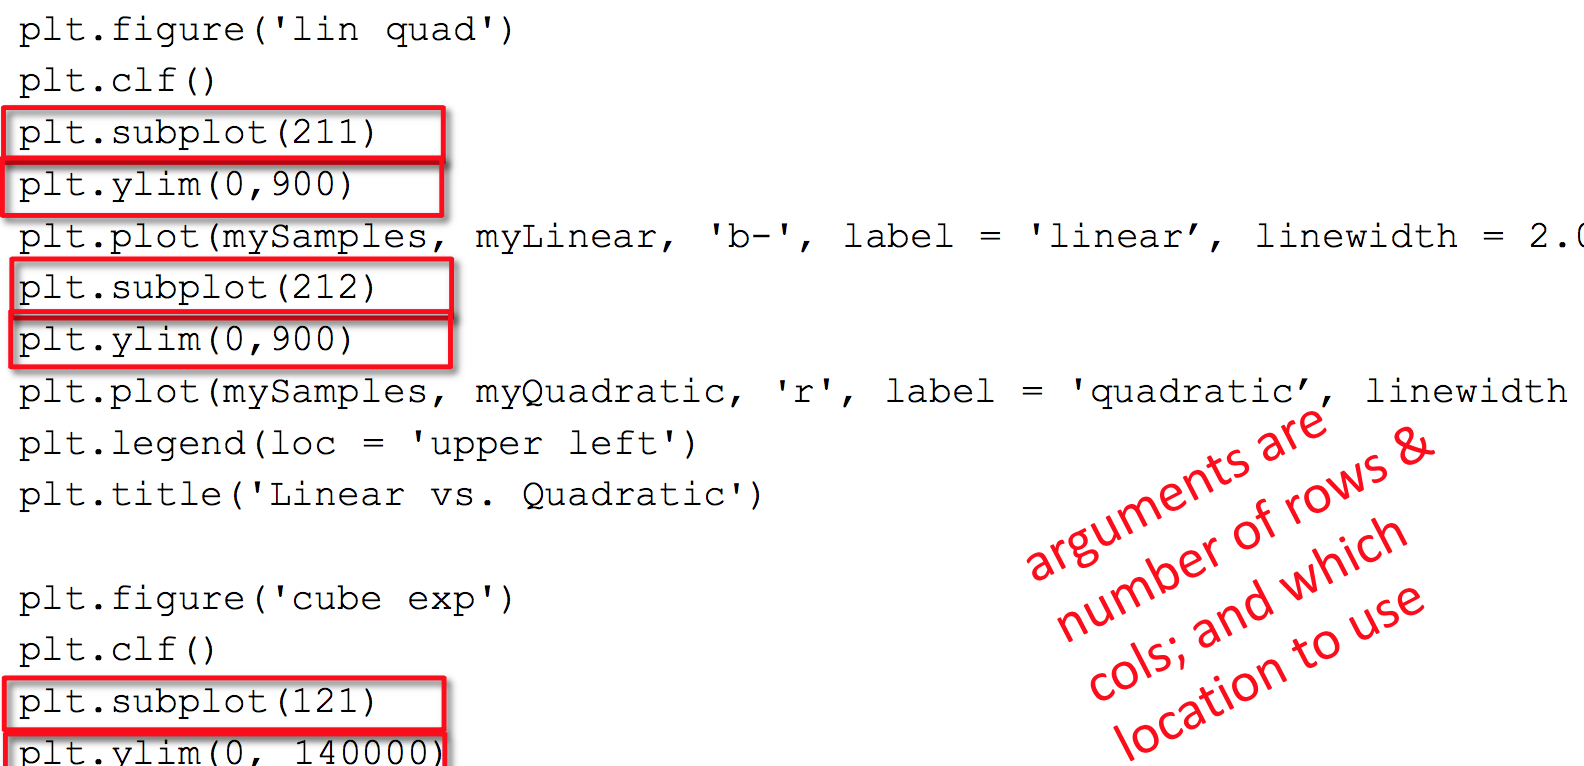
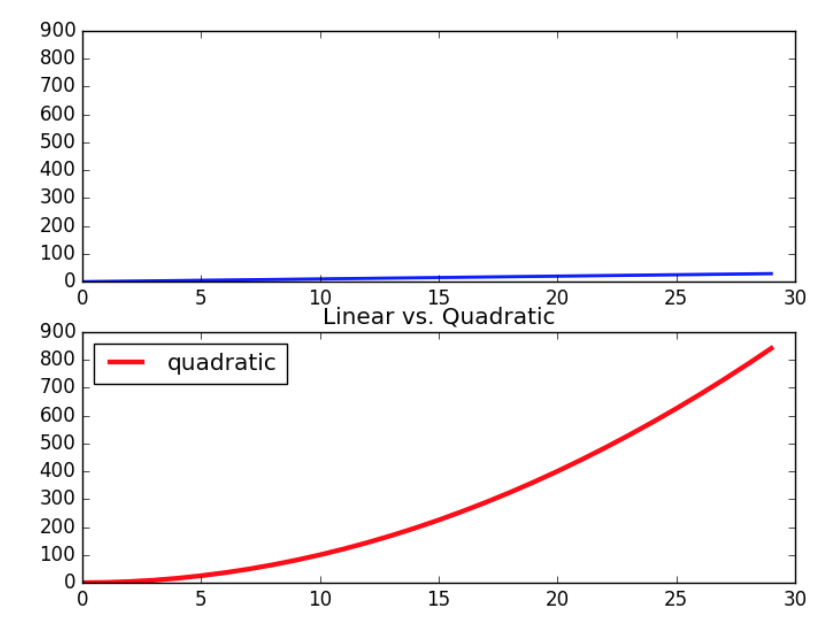
4) subplot
plt.subplot(211)参数211代表的是,2行,1列,最后一个1代表which location to use
